Blogs and articles
Data Spotlight: Race Equity
Assessing Inclusivity in IPS: A Spotlight on Race
I am the new(ish) Data Manager at IPS Grow. I started on 31st January this year and have been working hard behind the scenes to build a more robust data strategy for IPS Grow and help carry us forwards with the new contract. I have set improvement in motion internally at IPS Grow and externally with the IPS Grow reporting tool and our stakeholders.
I now aim to bring you regular insights into the efficacy of IPS and to better demonstrate the magnificent work that you are all doing to improve the lives of those with severe mental illness, alcohol & drug addictions and more with the expansion of the IPS offering around the country.
IPS success is well known and understood by those of us that work in this field and are passionate about the positive impact and outcomes the IPS framework has on individual lives. Sometimes, however, there are times when people question if IPS really can be this good! One example is around Race Equity.
Recently, I was asked if we are clearly able to demonstrate that IPS is equitable for all regardless of race and/or ethnicity from any of the data captured.
There is a published paper: “Individual placement and support: cross-sectional study of equality of access and outcome for Black, Asian and minority ethnic communities” produced collaboratively by Rachel Perkins, Rash Patel, Amelia Willett, Laura Chisholm and Miles Rinaldi.
It found that:
There were no significant differences between the proportions of people who gained employment. The data strongly suggest that people from BAME communities are not differentially disadvantaged in relation to either access to or outcomes of IPS employment services.
This is a terrific endorsement of the IPS model for our clients across the country.
Looking at the data, the sample set is London-based. I wanted to see how this finding extrapolated out to the country as a whole. There are various ways to approach this but, despite its challenges in recording outcomes for IPS data, MHSDS does have some useable and valuable data with regard to Race Equity.
Below are four graphics that show the breakdown of Employed at Referral and Employed at Discharge rates, as well as Time to first contact and Duration of time in service. There are several other comparisons that you can make within the MHSDS dashboard so please go and have a look.
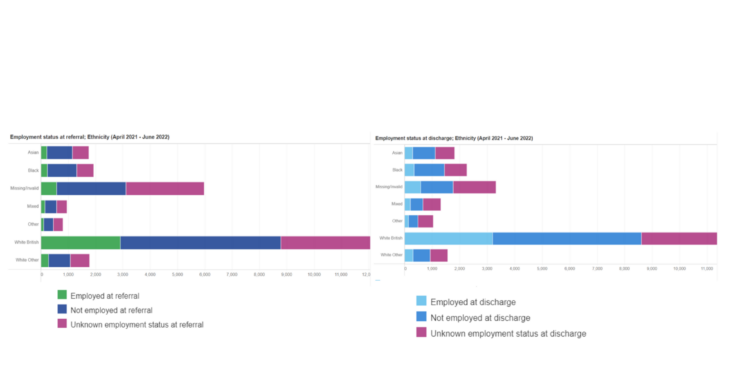
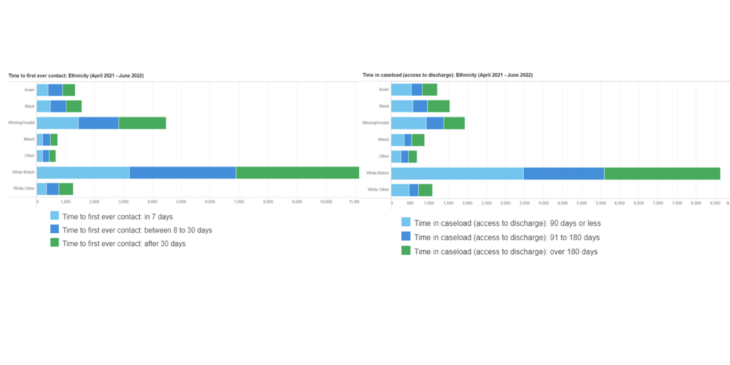
The graphics above show that on the macro level, race equity truly does exist across all the services that are reporting this data. It is almost precisely equitable for every category of race/ethnicity. This is something to be proud of and to share with your colleagues and clients, particularly if they feel that they may not gain as much benefit from the IPS method as their white, British counterparts.
There is more analysis to be done. I would like to take a deeper dive over time and see if the local population data shows the same results or if there are pockets of the country where more equity could be achieved. This is a work in progress.
I hope this small highlight has been of some value. I will be focusing on different areas over time. If you have any specific areas of IPS data that you would like to see in the Data Spotlight please get in touch with me at Miranda.brennan@socialfinance.org.uk
Miranda